oc aibom graph
oc aibom graph <name> [<name>...]
Charts the telemetry time series stored with one or more AIBOMs. The series are the downsampled per-metric lines aibom-webhook-service saves in an AIBOMTelemetry object when a run completes, so this works long after Prometheus's retention window has passed. AIBOMs created without a stored series (older ones, or runs where Prometheus had no data) are left out with a note.
oc aibom graph my-run
oc aibom graph run1 run2 run3 --metric gpu_utilization,memory_usage
oc aibom graph run1 run2 --pods
oc aibom graph run1 run2 --text --width 100
Interactive view
On a terminal, graph opens a full-screen view (on the alternate screen, like less) with one braille line chart per metric. Every run you name is overlaid in its own color, as in the console plugin's compare view.
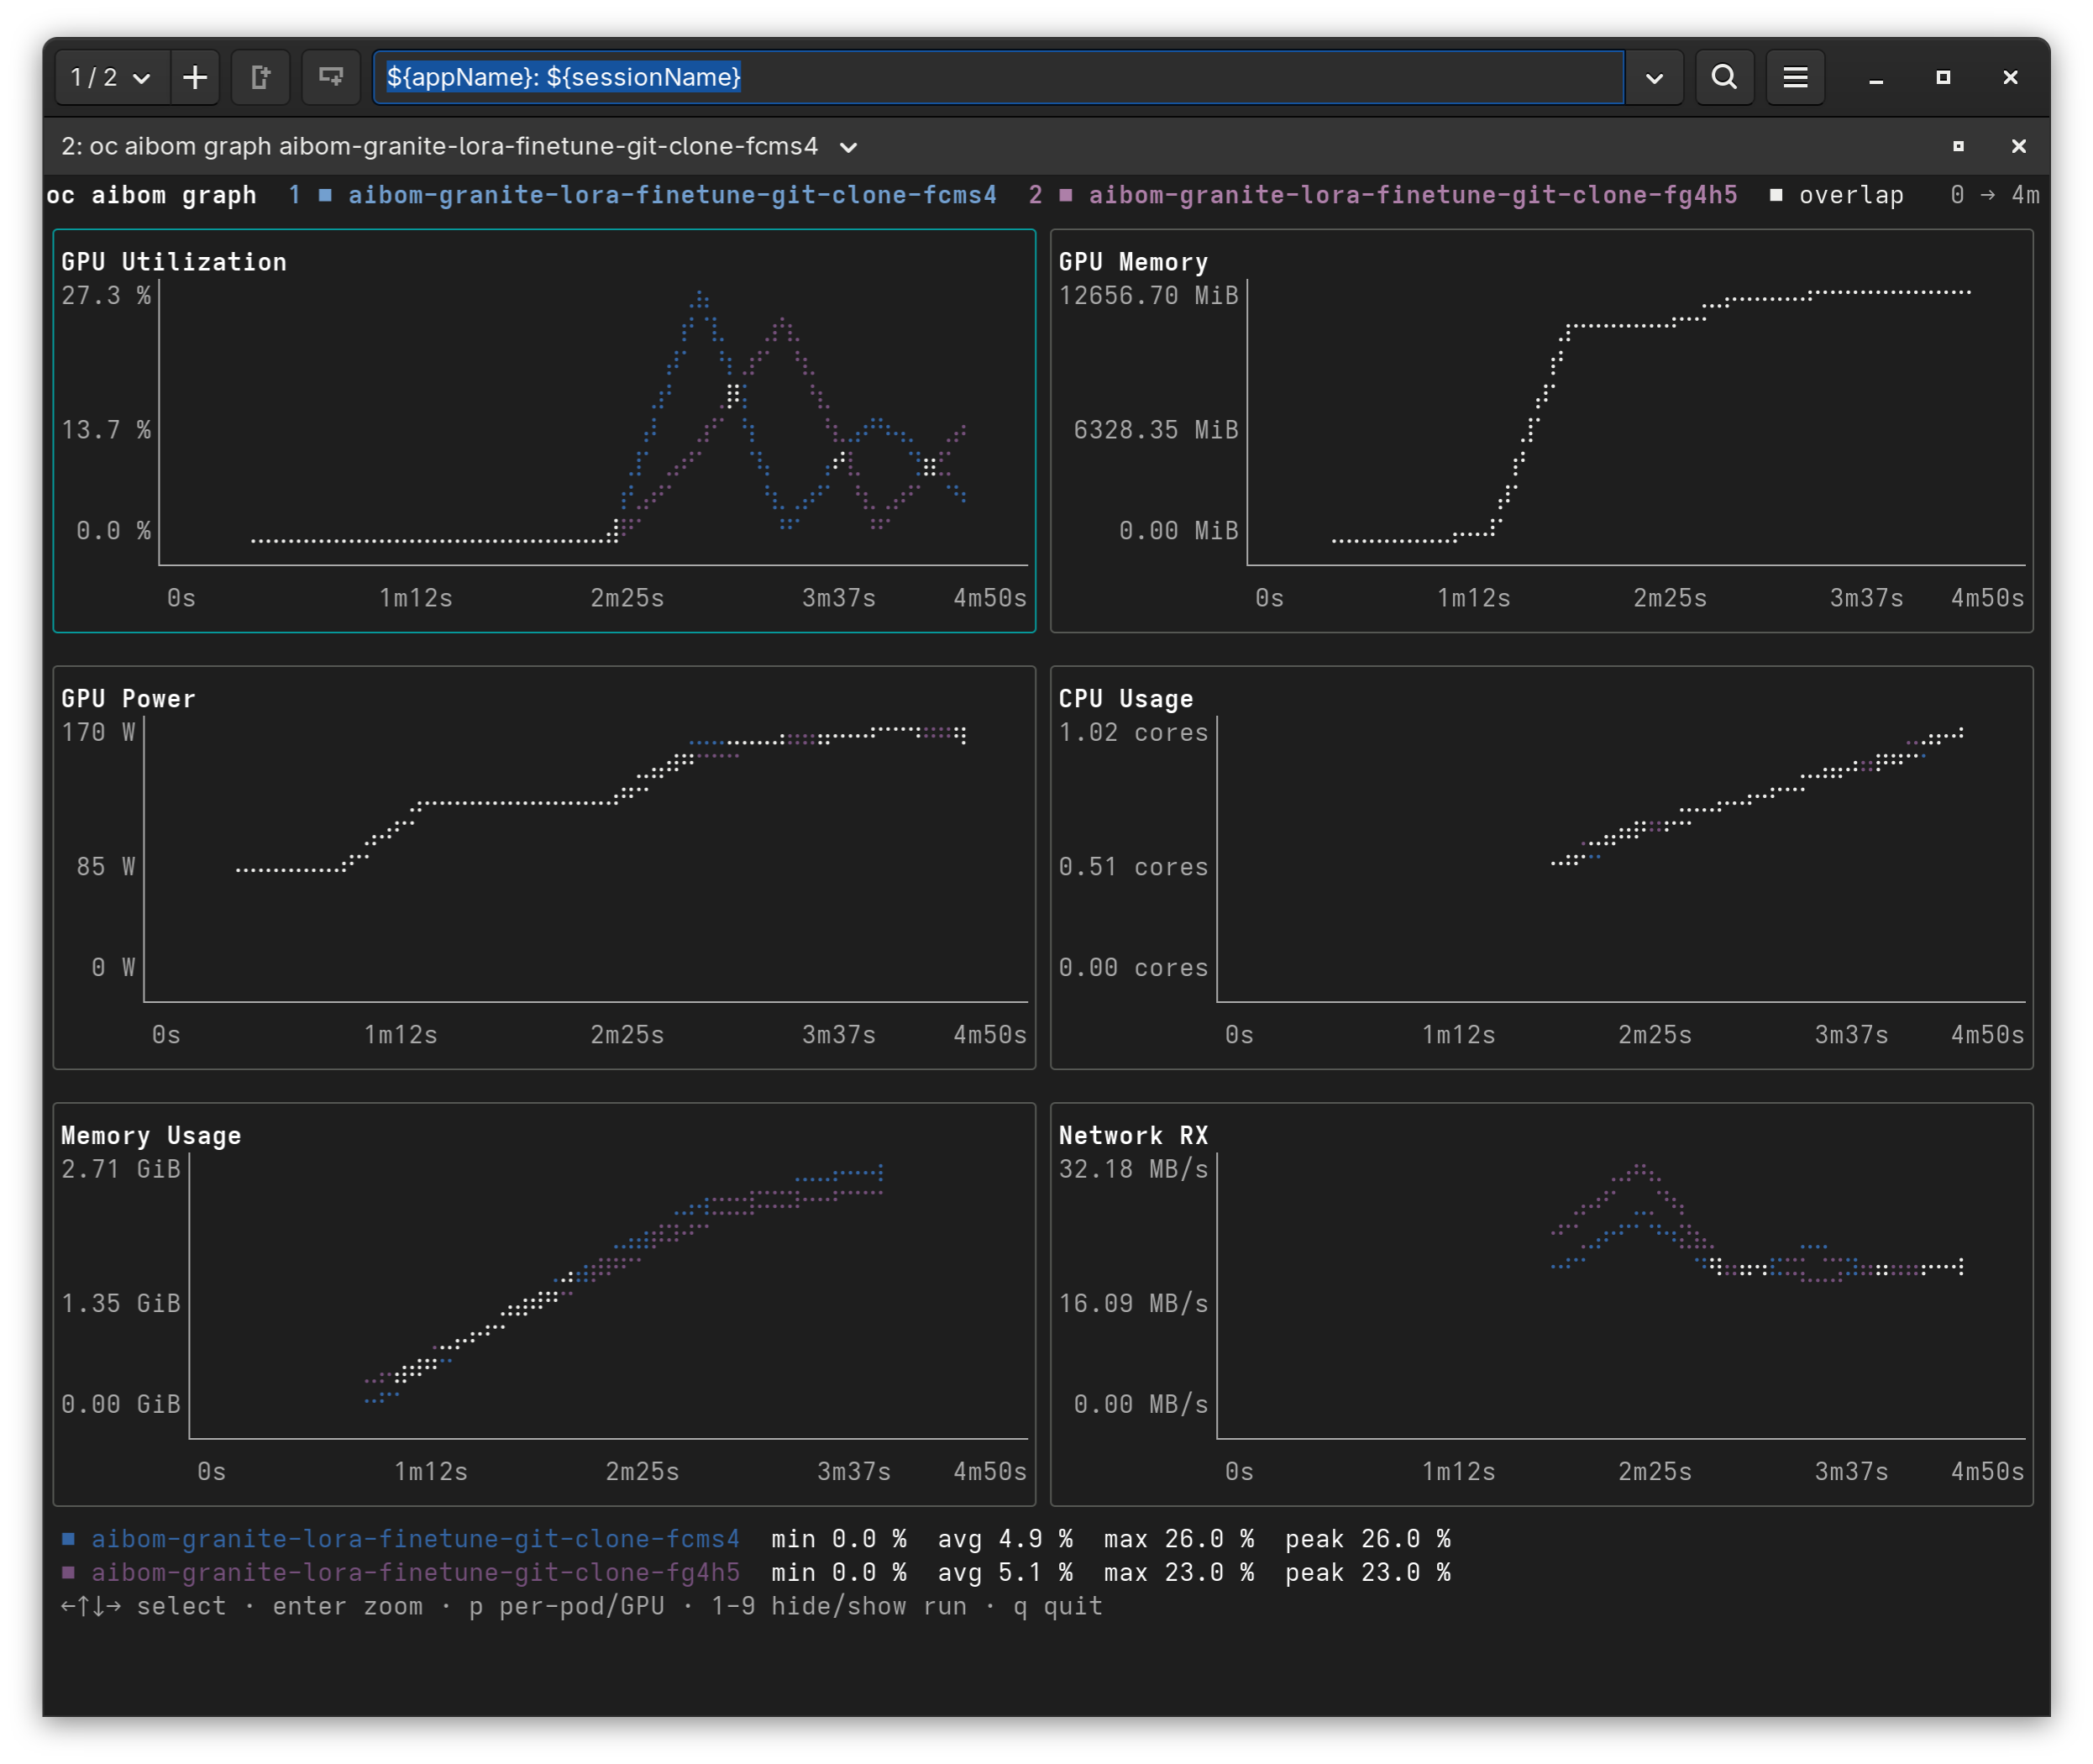
- Time axis: each run is measured from its own start, on a shared axis that spans the longest run. A shorter run draws as a shorter line.
- Value axis: all runs in a panel share one scale, so heights are directly comparable.
- Footer: min, avg and max for the selected metric, per run, plus the per-bucket peak where one was recorded.
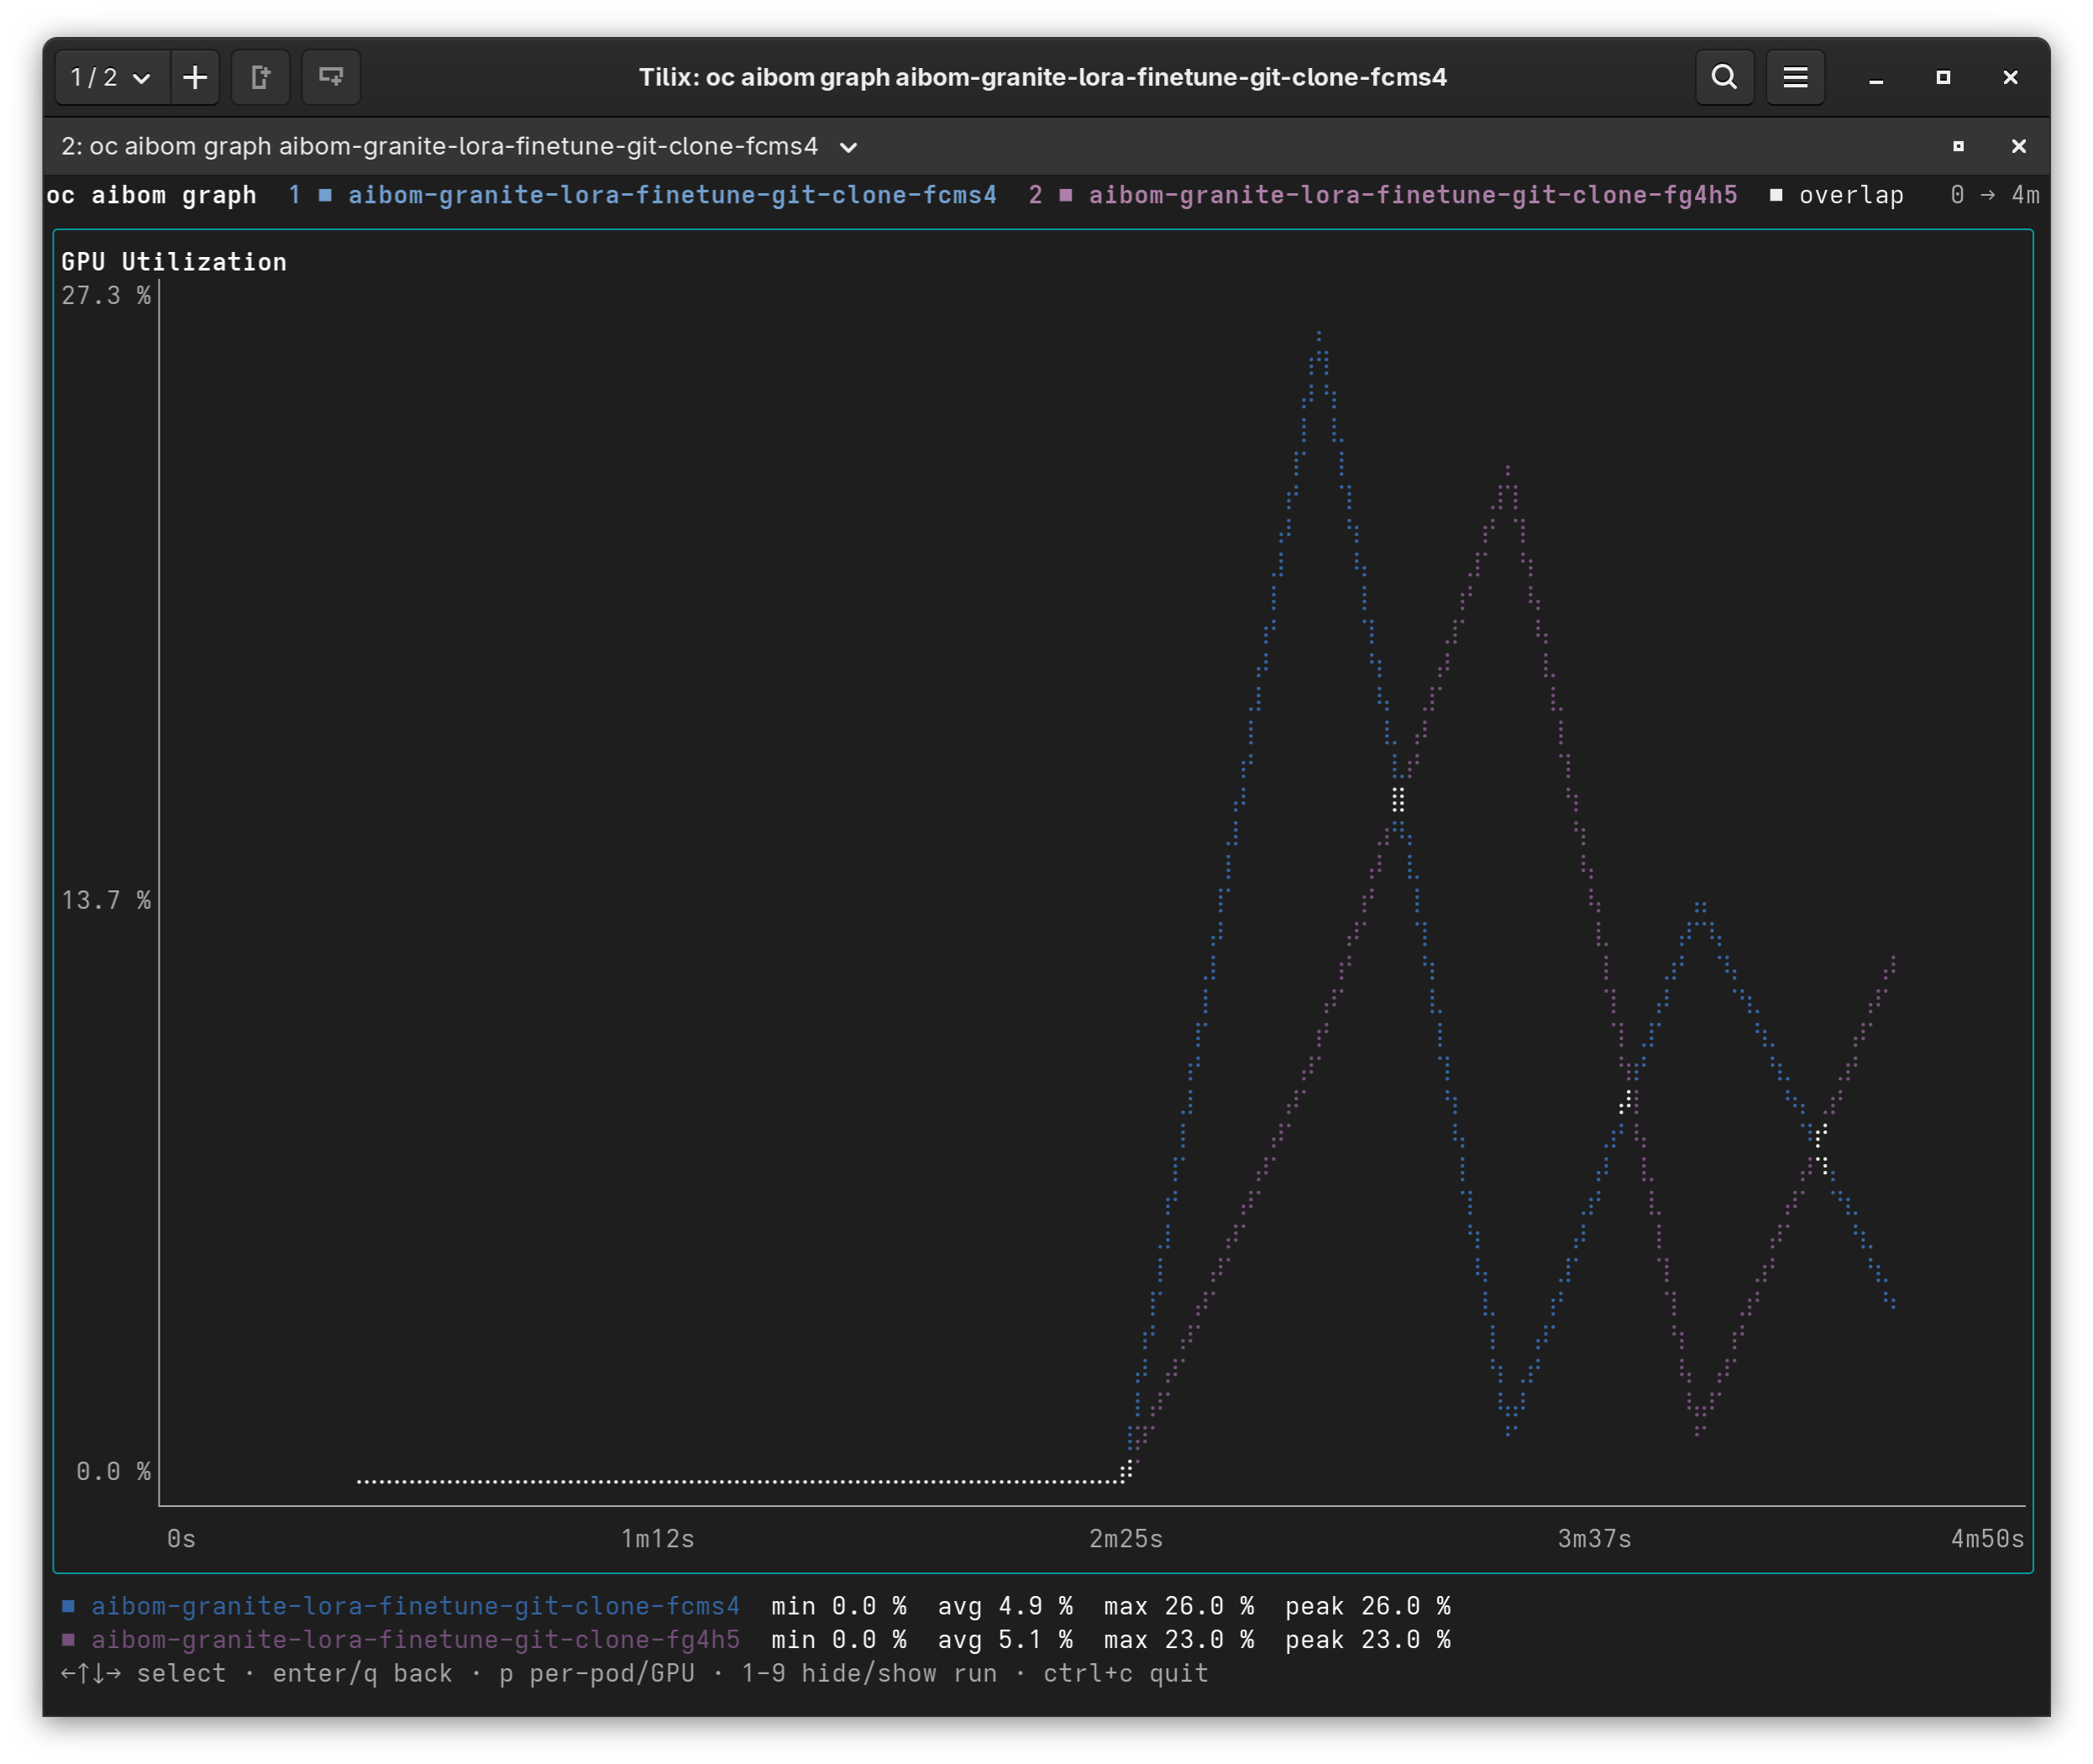
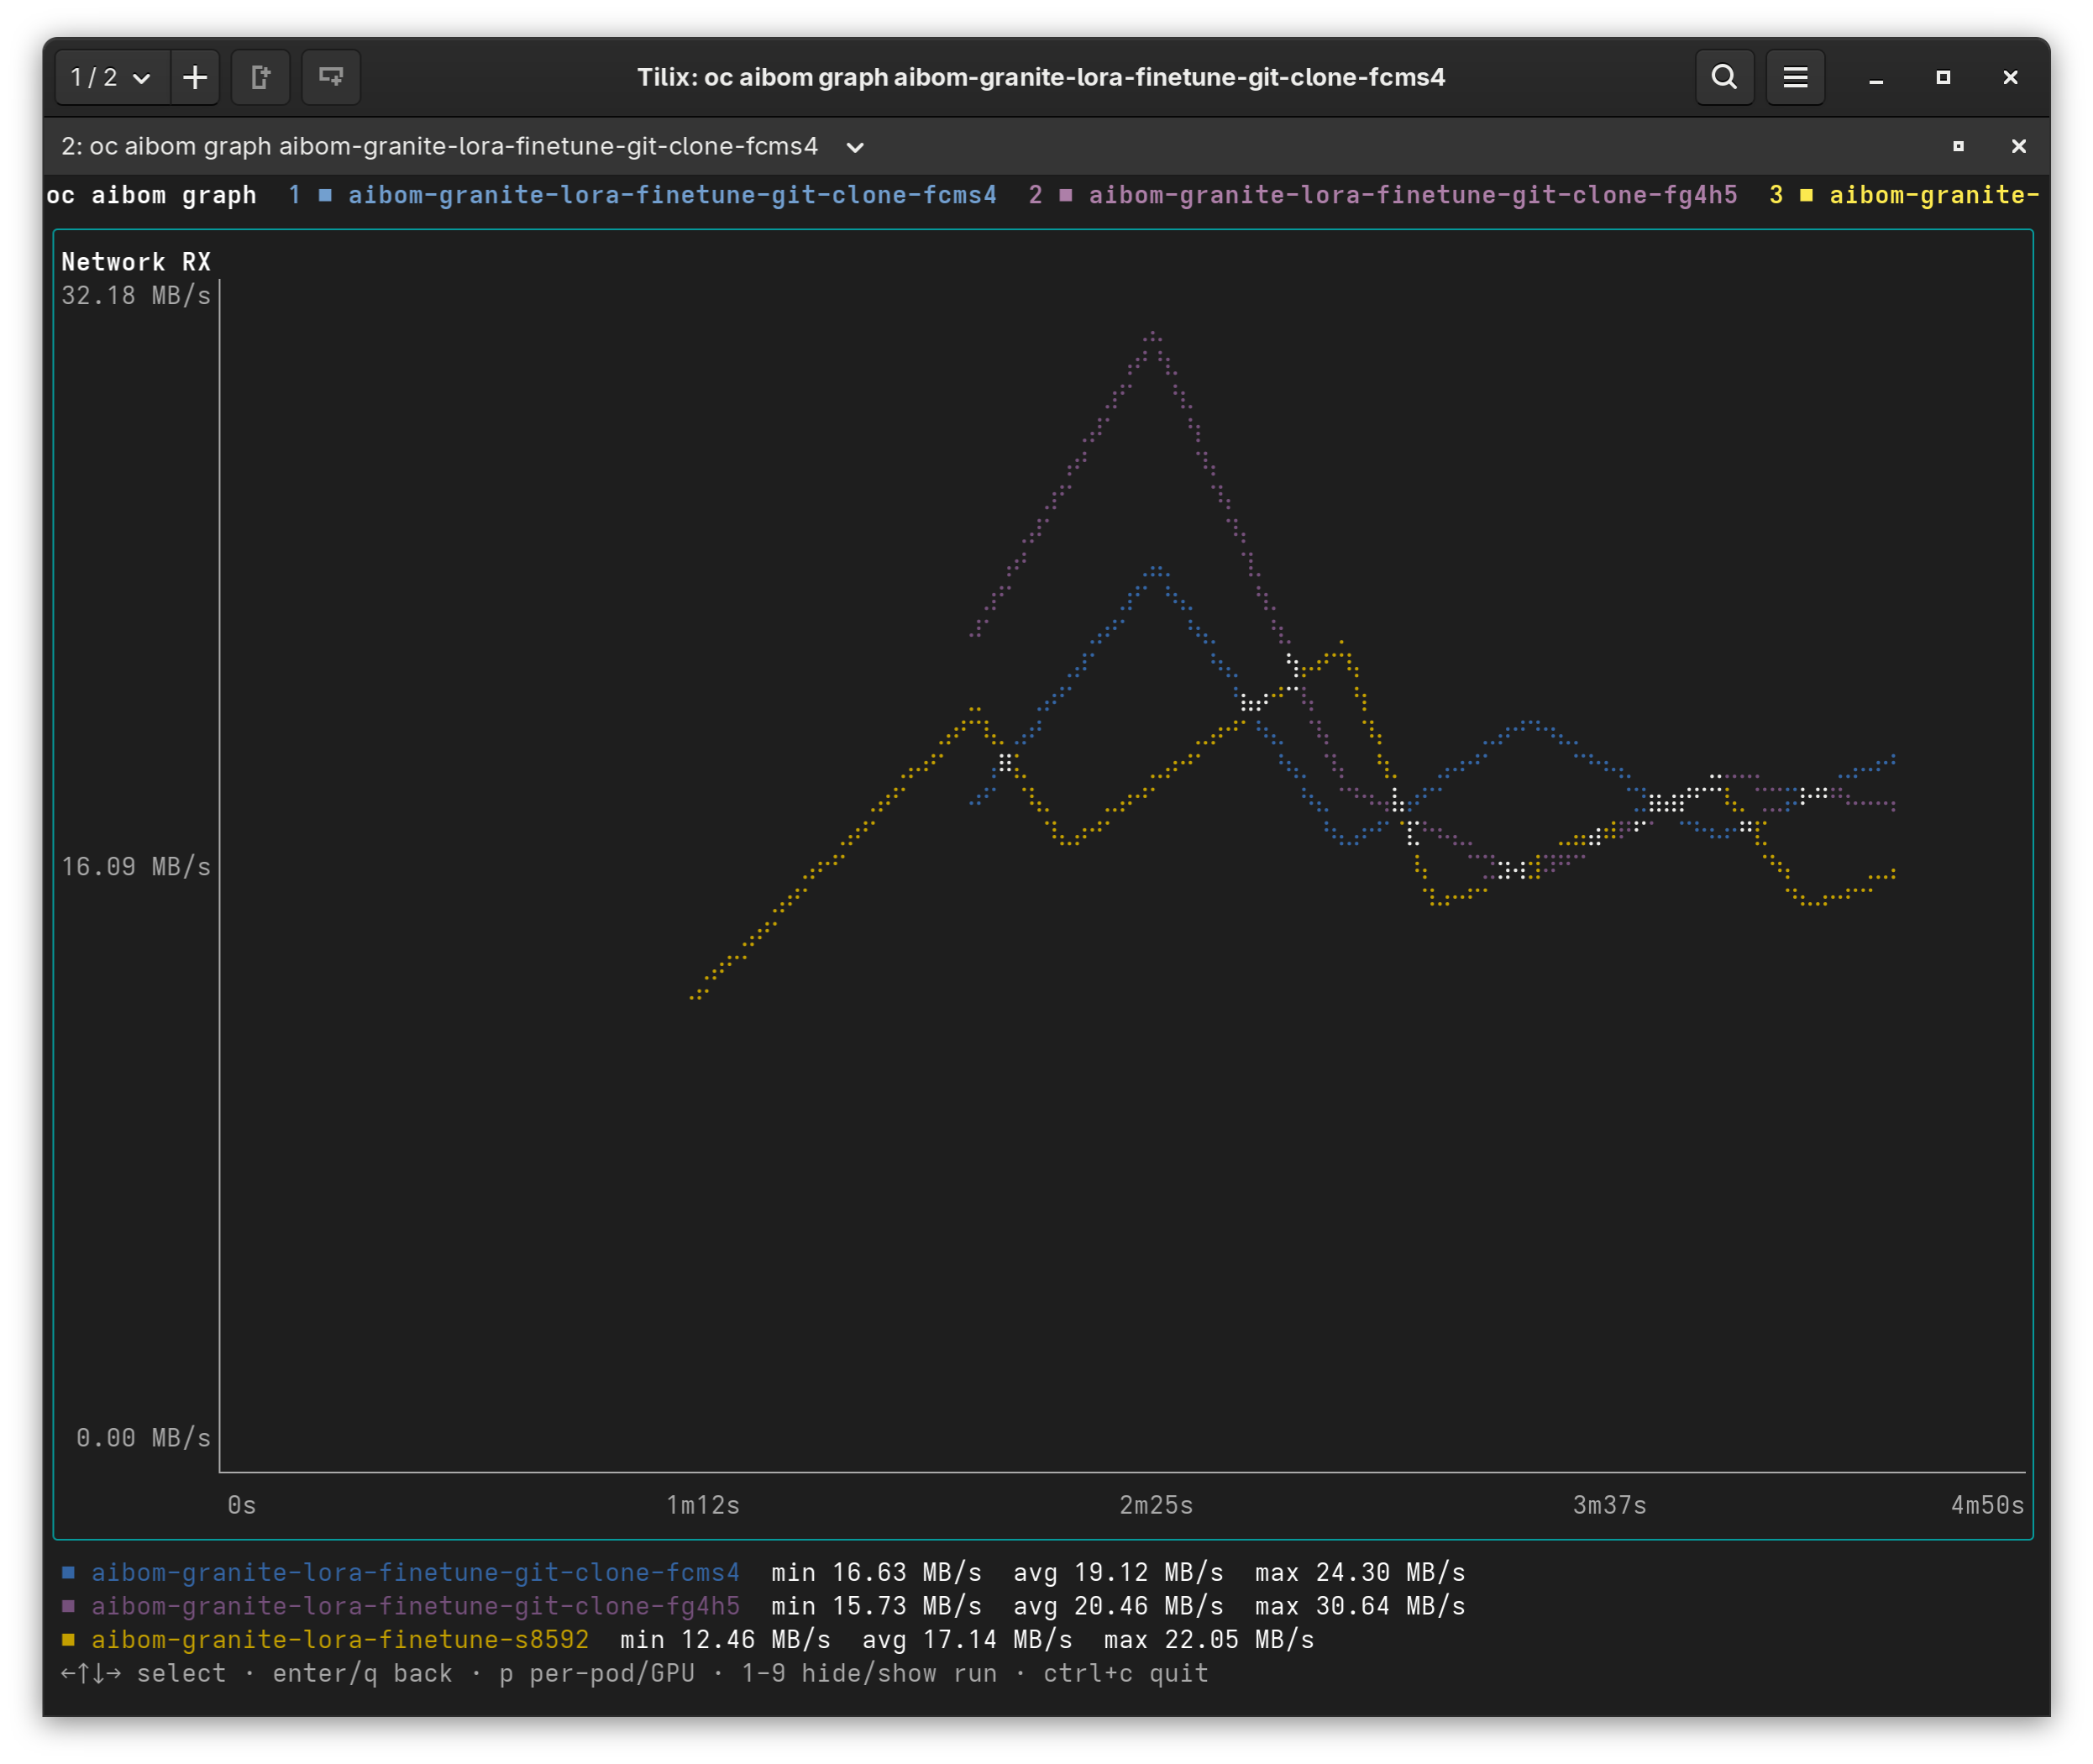
Press enter to zoom the selected metric full screen.
Overlapping lines
A terminal cell can only hold one color, so where two runs' lines land in the same cell one would normally hide the other. Cells where the runs' points actually coincide are drawn white (the ■ overlap entry in the header). In a cell that only holds points from several runs without coinciding, the run with the most points there wins.
To look at one run on its own, hide the others with 1–9. The value scale stays fixed, so nothing jumps when you toggle.
Keys
| Key | Action |
|---|---|
← → ↑ ↓, h j k l, tab |
Select a metric |
enter, z |
Zoom the selected metric; again to go back |
1–9 |
Hide or show that run (numbered as in the header) |
p |
Per-pod, per-GPU or per-container lines instead of each run's aggregate |
t |
Show or hide the red limit line |
q, esc |
Go back from a zoom; otherwise quit |
ctrl+c |
Quit from anywhere |
p only changes a run that has more than one series stored for that metric.
When the graph is opened from the interactive browser rather than as a standalone command, a [d] Detail view / [g] Graph view tab bar appears at the top: d jumps to the describe/compare page for the same run(s), and q/esc backs out to the list instead of quitting. Detail is dropped at record time for a metric with more than 64 series, in which case the aggregate is shown.
Text output
When stdout isn't a terminal (piped to a file or less), or with --text, graph prints one sparkline row per run per metric instead. The time and value scales are shared the same way as in the interactive view.
Integrity
Before charting, each run's series is checked against the digest in its signed AIBOM data, the same check describe reports on its Telemetry Series: line. A series that fails (✗ DIGEST MISMATCH) is not charted. The result for each run is printed when you quit, or before the output in text mode.
Flags
| Flag | Meaning |
|---|---|
--metric <keys> |
Only graph these comma-separated metric keys, for example gpu_utilization,memory_usage. An unknown key lists the keys that exist. Default: all. |
--pods |
Start with per-pod, per-GPU and per-container lines (toggle with p). |
--text |
Print sparklines instead of opening the interactive view. |
--width <n> |
Text-mode width in columns. Default: the terminal width. |
Metric keys are the ones stored in the series: gpu_utilization, gpu_memory_used, gpu_power, cpu_usage, memory_usage, network_receive, network_transmit, storage_read_throughput and storage_write_throughput, plus vLLM's time_to_first_token_seconds, inter_token_latency_seconds, num_requests_running, num_requests_waiting, kv_cache_usage, prompt_throughput and generation_throughput for inference runs.
Reading a series needs permission to get aibomtelemetries. The webhook chart's aibom-view ClusterRole grants it to anyone who can already view AIBOMs.